

Can global trade predict the spread of invasive species?
Invasive alien species are one of the most destructive yet overlooked pressures on biodiversity. In the infamous 2019 IPBES Global Assessment Report on biodiversity, invasive alien species were identified as one of the 5 main direct drivers of biodiversity loss worldwide (what we refer as the “5 pressures” as you can read here). Yet the rapidly growing threat that invasive alien species pose to biodiversity, ecosystem services, and human well-being is generally little understood and poorly quantified by decision makers.
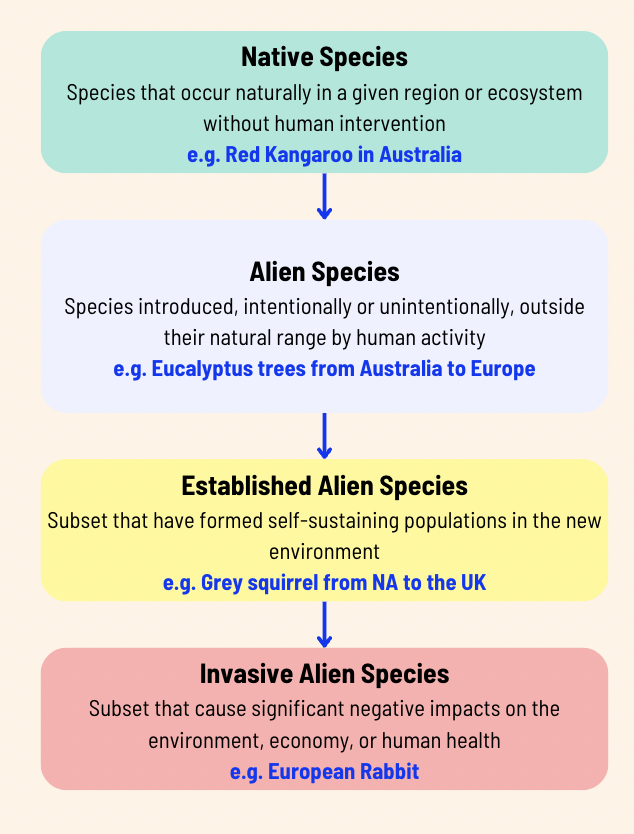
What are invasive species?
Alien species are species found outside their natural range as a result of human activities. When these species are able to proliferate —for example, due to the absence of natural predators—and cause significant negative impacts, they are classified as “invasive alien species” (IAS). IAS reduce overall species diversity by outcompeting native species resulting in the potential disruption of ecosystem services.
Source: Global Assessment Report on Biodiversity and Ecosystem Services 2019 - IPBES
This process is referred to as “biological invasion”, where human activities, either intentional or unintentional, transport and introduce species to new regions outside their natural range, where they may establish, spread, and cause ecological disruption.
What is the current situation with IAS?
The global spread of IAS is accelerating at an unprecedented pace. More than 37,000 established alien species have been introduced by human activities across all regions and biomes on Earth. Alarmingly, new alien species are being recorded at a rate of approximately 200 per year, highlighting the growing scale of biological invasions. Of these, around 3,500 species are classified as invasive alien species (IPBES, 2023).
Source: Invasive Species and Global Climate Change - by L. H. Ziska & J. S. Dukes
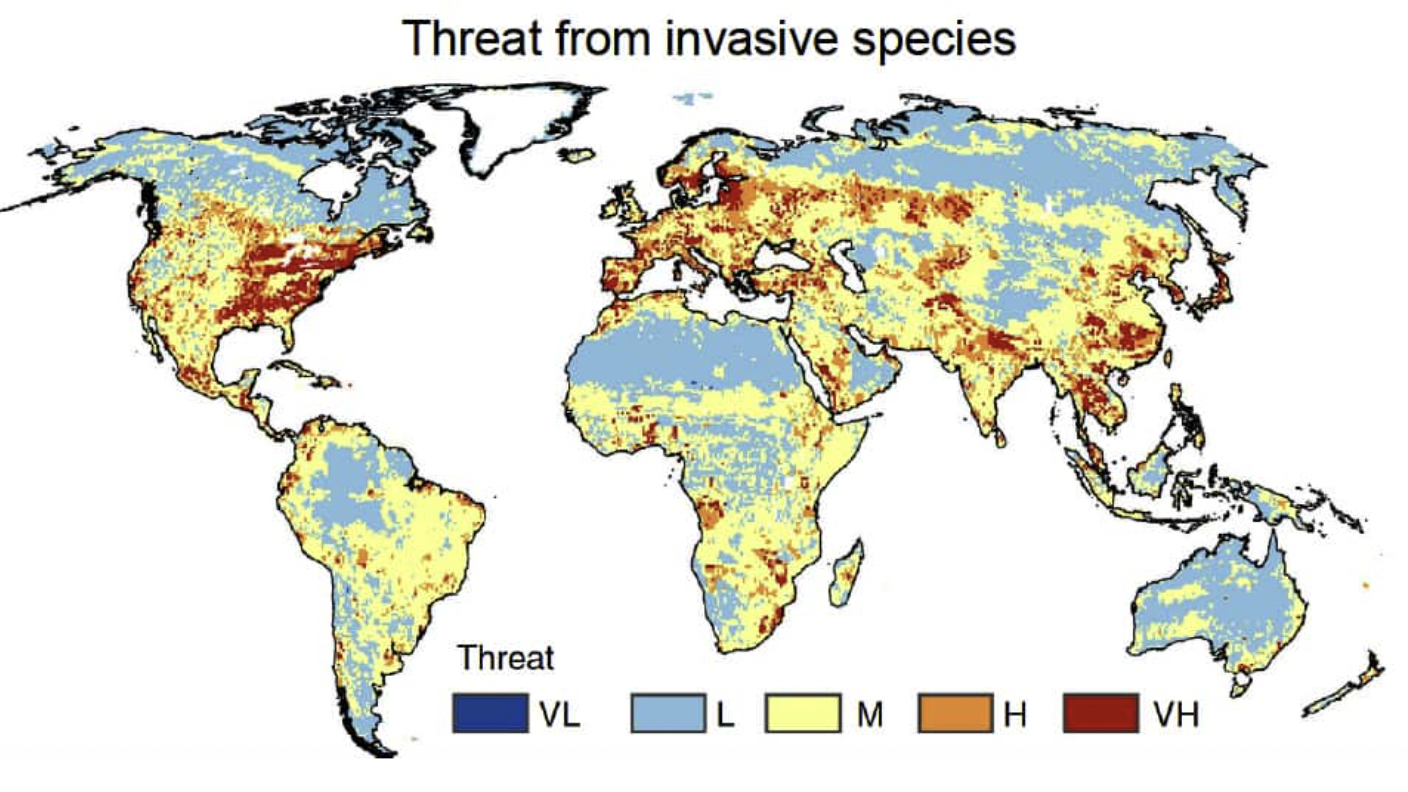
IAS are present on every continent, with an estimated 20% of the global land area classified as highly vulnerable to invasion (Early, R. et al., 2016). They have contributed—either solely or in combination with other drivers—to approximately 60% of recorded global extinctions, with a striking 90% of these extinctions occurring on islands, where ecosystems are often more fragile. They are the sole driver in 16% of documented global plant and animal extinctions, underscoring their devastating impact on biodiversity.
The economic cost of biological invasions has quadrupled every decade since 1970, reflecting both direct damages (e.g., loss of agricultural productivity, infrastructure damage) and indirect costs (e.g., biodiversity loss, ecosystem service degradation). In 2019 alone, the estimated global annual economic cost of biological invasions was a staggering $423 billion (IPBES, 2023).
Beyond economics, 8% of IAS cases negatively impact human health, spreading diseases, causing allergies, or disrupting livelihoods dependent on healthy ecosystems.
What are famous examples of IAS?
IAS vary widely in their impacts, but several high-profile cases illustrate the breadth and severity of the issue:
European rabbits in Australia: originally introduced in 1859 by Europeans for hunting purposes, just 24 rabbits rapidly multiplied due to the absence of natural predators. By the 1880s, they had spread across millions of hectares, causing widespread overgrazing, leading to soil erosion and the decline of native species. Despite efforts, rabbits remain a major ecological and economic threat today.
Amazon water hyacinths: first introduced to North America in 1884 as an ornamental plant, the water hyacinth quickly spread to rivers and lakes due to its rapid reproduction rate, doubling its mass in two weeks under optimal conditions. By the mid-20th century, it had become a global invasive species, choking waterways, reducing water quality, and disrupting fisheries in regions like Africa’s Lake Victoria and Southeast Asia.
European shore crab in North America: believed to have arrived in the early 1800s via ballast water from European ships, the European shore crab became established along the Atlantic coast by the 1900s. Its spread accelerated in the late 20th century, particularly along the Pacific coast, where it decimated shellfish beds, causing multi-million-dollar losses in fisheries and disrupting marine ecosystems by preying on native shellfish and competing with local species.
Why are impacts of IAS hard to quantify & modelise?
Despite their significant impact, IAS remain challenging to model. Why is this the case?
Context-dependent impacts: the effects of IAS vary greatly depending on region, species interactions, and local environmental conditions.
Lag effects complicating baselines: some invasions take decades to manifest ecological consequences, making baseline measurements difficult.
Limited global datasets: unlike GHG emissions or land use change, there is a lack of consistent, comparable global data on IAS introductions and spread.
Complex feedback loops between direct & indirect drivers of change in ecosystems: the future threat posed by IAS is difficult to predict due to complex interactions.
Although extensive research has been conducted to identify the key drivers behind AIS introduction and their relative contributions, critical gaps remain: quantified links between economic activities and AIS introduction drivers, and quantified links between AIS introduction drivers and biodiversity impacts. As a result, the ecological impacts of these introductions are not yet integrated into Life Cycle Impact Assessment (LCA) frameworks. LCAs that evaluate trade-related impacts underestimate the full environmental consequences of commodity transportation, potentially leading to incomplete risk assessments.
However, promising research is emerging to address those gaps. A notable example is the work by J. Borgelt et al, published in 2024. Key contributions from this research include the development of country-to-country Characterization Factors (CFs), assessing biodiversity impacts linked to the unintentional spread of alien species through global goods transportation. The team designed globally applicable CFs that quantify the damage caused by introduced alien species to terrestrial ecosystems, based on origin–destination trade routes. The CFs utilize the Potentially Disappeared Fraction (PDF) of terrestrial species as the primary metric, quantifying ecosystem damage per kilogram of transported goods in the importing country.
How do we take IAS into account at darwin?
At darwin, we take a similar approach: leveraging international transport of goods as a proxy to assess the risk of biological invasions.
As human activities—particularly global trade, transportation, and habitat modification—are the main drivers of species introductions, a business’s exposure to global trade intensity can be used as a proxy for assessing IAS risk exposure. Assuming that the higher the trade flow (e.g., imports/exports of goods, shipping routes, tourism), the greater the risk of introducing invasive species. And that high-risk industries (e.g., agriculture, forestry, aquaculture, pet trade) have a stronger link to species introductions.
While not a perfect measure, trade exposure provides a scalable and quantifiable way to assess the risk of biological invasions in biodiversity footprint assessments. That being said, we are continuously working to refine our pressures framework. If you come across any relevant scientific research on IAS modeling, feel free to share it with us.